
Platform liquidity – KPIs for growing and steering your marketplace

The traditional metrics used for platform businesses are net revenue, users, average order value, and CAC vs. LTV. Using these metrics gives us a fundamental understanding of the daily business, but they don't capture how efficient the core transaction between consumer and producer is. To understand and have KPIs to improve your marketplace, you need to measure the liquidity of a platform and its key drivers. In this post, I will look at two key platform business KPIs; Search to fill, and Utilization rate, that can give you more hands-on metrics that will help you grow.
According to known business literature, liquidity is "the probability of selling something you list or of finding something you are looking for". Now I will explain how we can measure and improve this probability? Understanding and measuring marketplace liquidity will give your platform business a clear outline for were to focus your resources and how to grow your business.
“Liquidity is the reasonable expectation of selling something you list, or find what you are looking for.”
The concept of liquidity is relatively easy to understand; however, measuring both sides is much trickier.
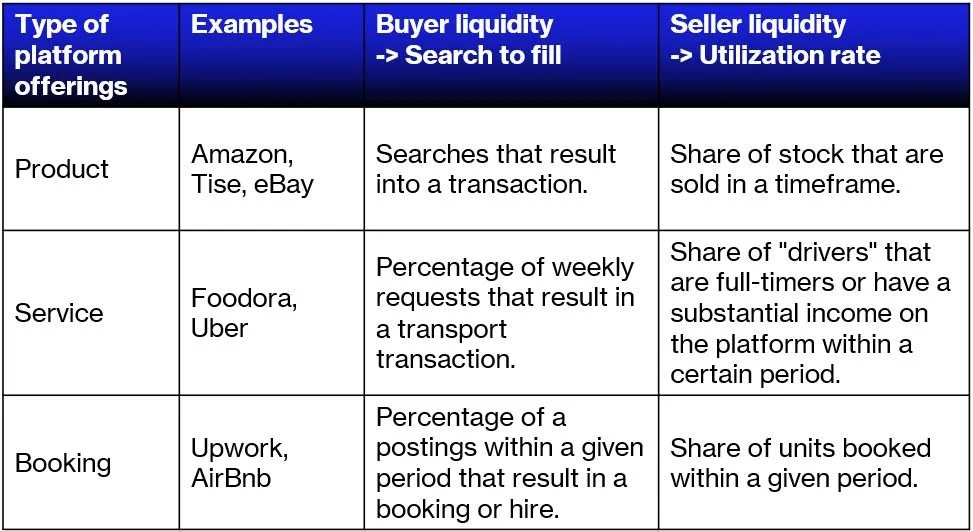
Buyer liquidity – from search to the core transaction (KPI: Search to fill %)
Looking at the buyer side first, liquidity is the likelihood that a request or a search leads to a core transaction. We can measure this in different ways depending on the marketplace model and characteristics. This can be the asymmetry in the market between seller and buyer, segment and geographical concentration, or the complexity of the product or service. In general, we are looking for a model to estimate "from search to the core transaction." The popular term used for this vital buyer liquidity KPI is "Search to Fill."
For marketplaces and webshops like Amazon, Tise, or eBay, this could be the percentage of search sessions over a given period that result in a purchase. Airbnb or Upwork could be the percentage of apartment or job postings within a given period resulting in a booking or hire. For Foodora or Uber, this could be the percentage of weekly requests that result in a transport transaction.
Supplier liquidity – utilization of supplier offerings (KPI: Utilization Rate %)
On the supply side, we measure the Utilization Rate of the offering provided from the supplier side. Same as the buyer liquidity, we need to take into account the characteristics of the market and find the most useful indicator that can be used in business operations when balancing the platform's liquidity. The popular term used for this vital supplier liquidity KPI is "Utilization rate."
For marketplaces and webshops, we could look at the percentage of stock in a given period that is sold at the end of the period. For booking platforms, this could be a share of units booked within a given period. For food delivery platforms or ride-sharing, it could be the share of "drivers" that are full-timers or have a substantial income on the platform within a certain period.
The utilization aspect is both about turnover of stock, related to the liquidity and possibility to make a profit. But, as in ride-sharing, it is also essential to recognize the importance of being a substantial income for the driver. If not, they will be less focused on quality and good ratings, reflecting on the brand and network effects. This "utilization of labor" goes for most platforms where resource utilization is about human labor.
Differentiate transactions according to liquidity
To get a more accurate picture of liquidity, marketplaces should measure both "Search to fill" and "utilization rate" on a granular level, both per segment, location and even in time intervals. This way, we can easier differentiate the transactions and have the hands-on knowledge to make things better on the granular level. VCs are looking at these KPIs, and improving them will reflect well on the valuation of your platform.
Market asymmetry determines liquidity levels.
The balance between sides on the platform will determine the liquidity levels you can expect or benchmark you against. All platforms have a asymmetry between sides, where one side sets the terms more than the other.
You will find the lowest liquidity in balanced markets where both sides opt in to the transaction in a dialogue. Typically, these double-commit markets are more tailored services with more friction, higher risk of leakage, and a lower liquidity level. In this case, you will focus more on the search to fill levels and find steps in the customer's journey that you can automate to reduce friction.

There will be less friction and higher liquidity in markets where one side commits and don't need to communicate with the other side. These marketplaces require one side to enter additional data for the matching, which is then done automatically. Measuring the utilization level will be crucial on the resource side. If the data matching is insufficient, either on not finding what you want (search to fill) or getting enough demand (utilization rate), the liquidity level will be to low to survive.
An interesting example here is AirBnB that started with a double commit model where both sides opted in and got into an agreement through dialogue. But, Brian Chesky saw that he could lock the supply side by making them commit to the calendar, adding available slots in the calendar, and adding enough additional data for automatic matching, moving into a one-sided model where the buyer picks. The matching is done automatically with no need for communication with the supply side. As a result, the liquidity improved with less friction in the booking process.